OpenTelemetry GenAI is the set of semantic conventions and instrumentation libraries that give generative AI calls standard span names, attributes, metrics and events. In a voice or avatar app, a library traces the model call, and you add your own spans for speech to text, text to speech and the avatar session.
What OpenTelemetry GenAI is
OpenTelemetry GenAI is a naming standard plus the libraries that apply it. The conventions define the span, attributes, metrics and events for a model call. Instrumentation libraries patch a model client so those spans appear without changes to your call sites.
Everything in it is marked Development. The spans, metrics and events documents all carry that status, so names can still change. Pin your library versions.
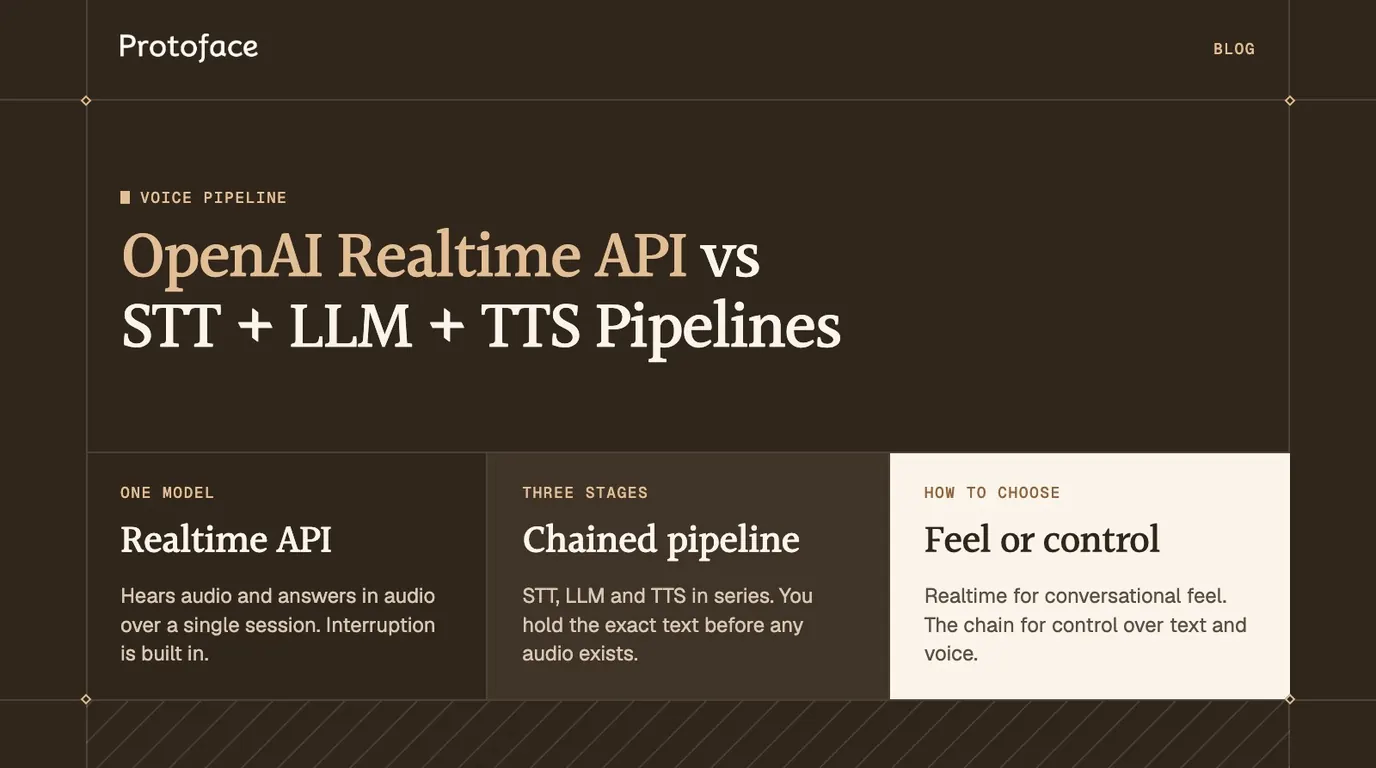
The conventions cover one model call. A voice agent with an avatar is a chain of speech to text, model, text to speech and video, so the other stages are yours to name. If you are still choosing how many stages to run, start with the comparison of the OpenAI Realtime API vs STT + LLM + TTS pipelines, because that choice sets how many spans a turn has.
What are the OpenTelemetry conventions for GenAI telemetry?
They define a client span per model call, a small set of gen_ai.* attributes on it, client metrics for duration and tokens, and an opt-in event that carries the full request and response. The span is named {gen_ai.operation.name} {gen_ai.request.model}, for example chat gpt-4o-mini, and its kind is CLIENT.
Name
Signal
Level
What it holds
gen_ai.operation.name
Span attribute
Required
chat, embeddings, execute_tool, invoke_agent and others
Modality.gen_ai.token.modality accepts text, image, audio and unknown, and gen_ai.output.type accepts speech. The spans document also lists gen_ai.usage.audio.input_tokens and gen_ai.usage.audio.output_tokens, so a speech-to-speech model can report audio tokens apart from text.
Renamed attributes.gen_ai.system became gen_ai.provider.name, and gen_ai.usage.prompt_tokens and gen_ai.usage.completion_tokens became the input and output token attributes. Libraries lag the documents: release 1.2b0 of the OpenAI instrumentation still records tokens in a gen_ai.client.token.usage histogram split by gen_ai.token.type, which the current token document does not list. Print the names your version emits before you build a dashboard.
Conversation ID. The spans document says not to fill gen_ai.conversation.id with a new UUID or a trace ID. Set it only when you hold a real identifier.
Set up OpenTelemetry GenAI instrumentation
Install the SDK, an OTLP exporter and one GenAI instrumentation package, then register the providers before you create the model client. The Python packages live in open-telemetry/opentelemetry-python-genai, which covers OpenAI, Anthropic, Bedrock, Google GenAI, LangChain, LlamaIndex and several agent frameworks. They are beta releases.
The Python code sends traces and metrics over OTLP and patches the OpenAI client. Each chat completion, Responses call and embedding produces a span named by the conventions, plus duration and token metrics. For streaming chat completions the OpenAI instrumentation README also lists time to first chunk and time between chunks.
Prompts stay out of telemetry by default.OTEL_INSTRUMENTATION_GENAI_CAPTURE_MESSAGE_CONTENT defaults to no_content. Set it to span_only, event_only or span_and_event only where your backend is allowed to store what users say.
That README does not list audio transcription, speech synthesis or realtime sessions, so those stages need spans you write.
Add GenAI attributes to your own spans
When a client has no instrumentation, open a CLIENT span yourself, name it by the convention and set the required attributes before the call. Add token counts after it returns.
call_model is your own function. It calls the provider and returns the reply text with the two token counts from the provider's usage field. Keep error.type to an error code or exception class, never the message.
Trace a voice pipeline: speech to text, model and text to speech
Make each conversational turn one trace, with a root span for the turn and one child per stage.
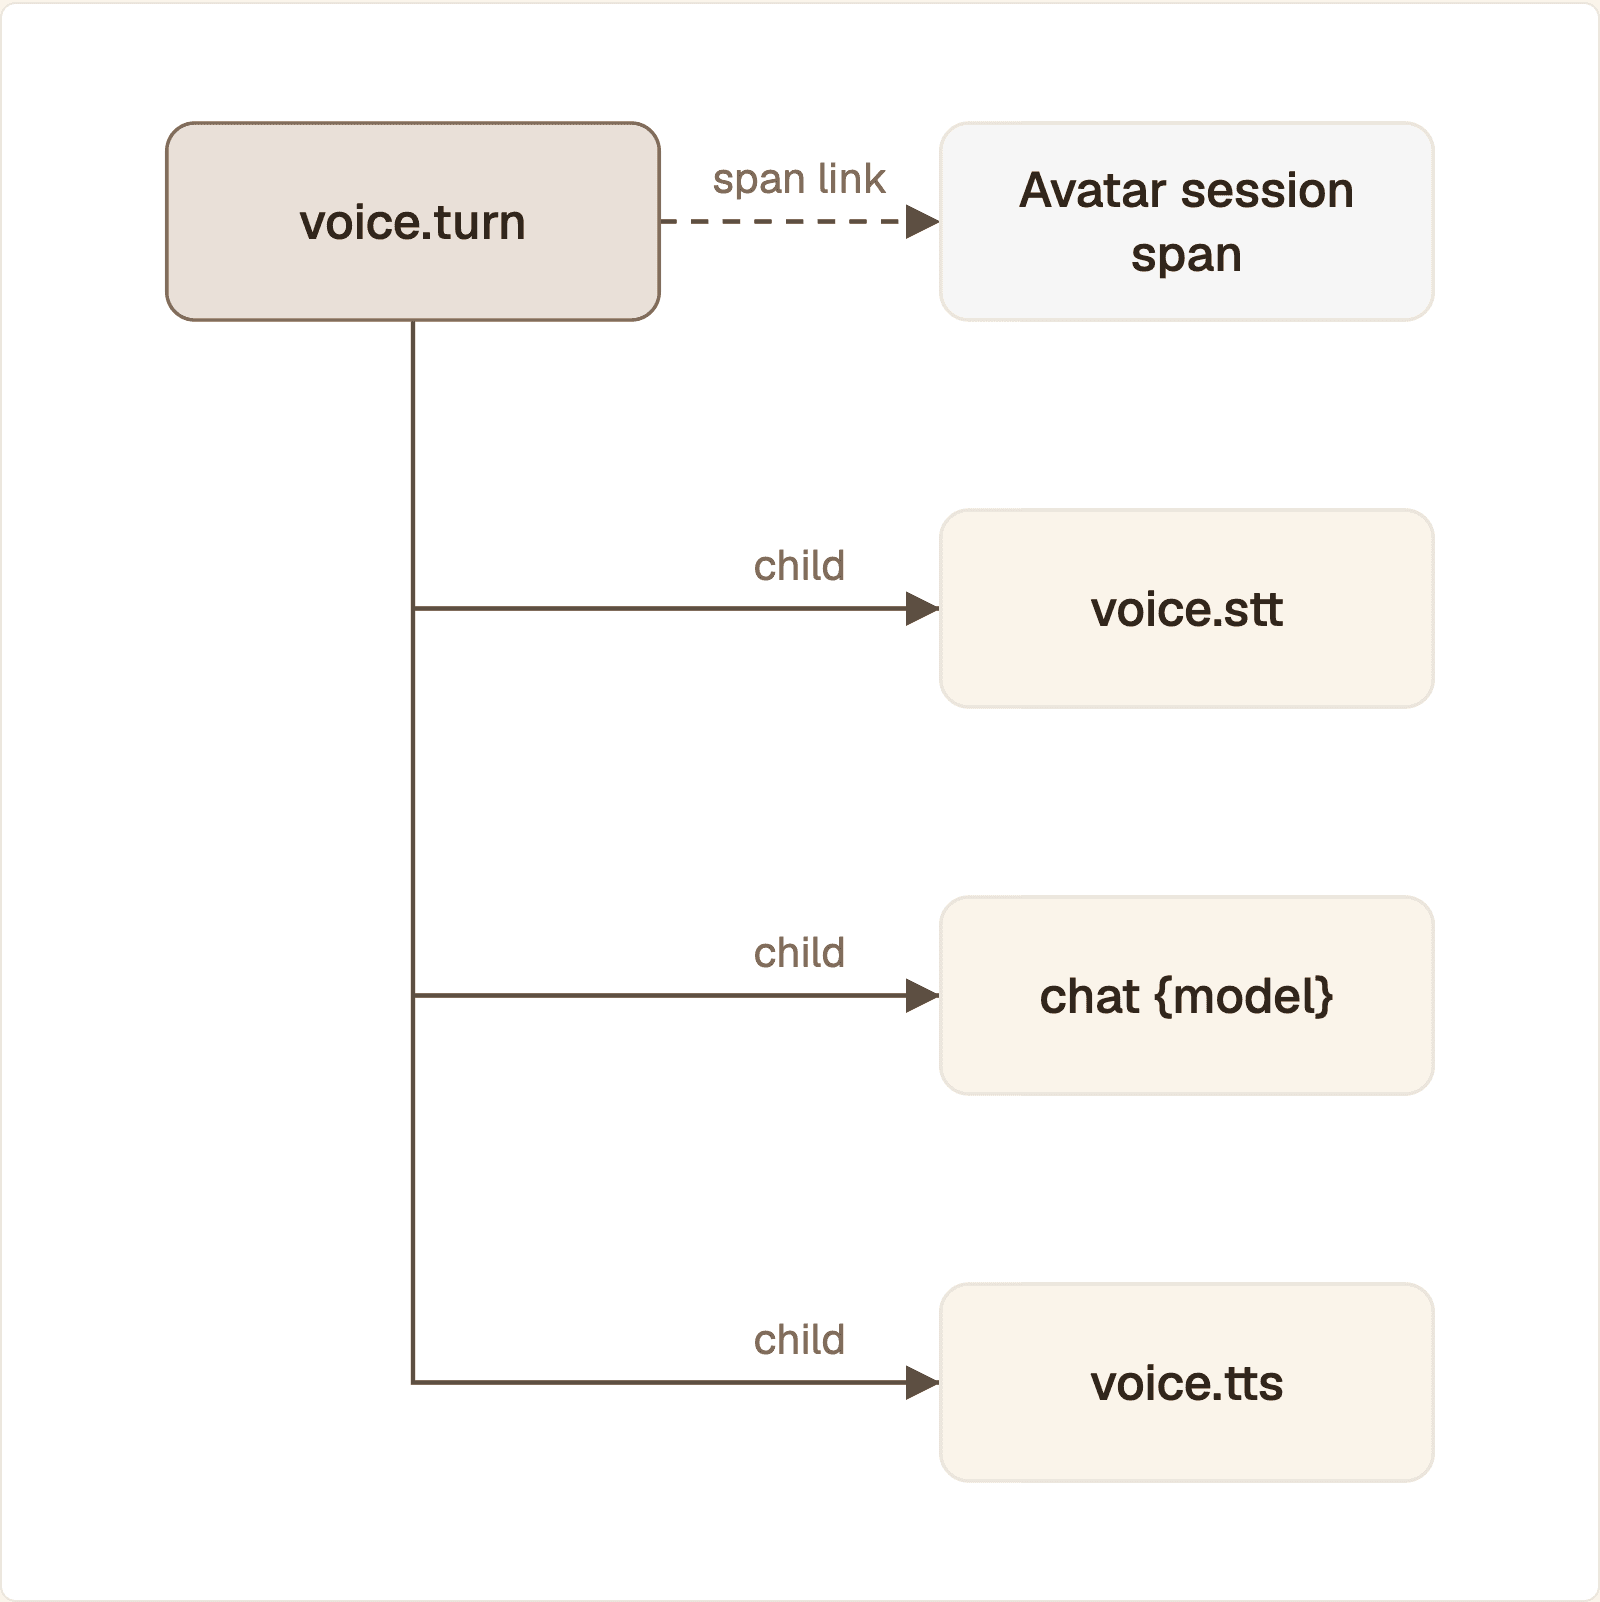
One turn is one trace. The three stages are children of voice.turn, and the avatar session is reached through a span link because it lives in its own trace.
The span tree for one turn of a three-stage pipeline with an avatar:
voice.turn, the root. Starts when the user stops speaking and ends when the reply audio has been sent. Custom.
voice.stt, child of the turn. Covers transcription. Custom.
chat {model}, child of the turn. Created by the instrumentation library. Standard.
voice.tts, child of the turn. Covers synthesis, with a voice.first_audio event on the first chunk. Custom.
A link from voice.turn to the avatar session span, which lives in its own trace. Custom.
With a speech-to-speech model, items 2 to 4 collapse into one span around the realtime response. Write that one by hand as a CLIENT span with the same GenAI attributes that traced_chat sets.
importtimedefrun_turn(audio,conversation_id,avatar_session_id,session_link):
withtracer.start_as_current_span("voice.turn",links=[session_link])asturn:
turn.set_attribute("gen_ai.conversation.id",conversation_id)turn.set_attribute("avatar.session.id",avatar_session_id)started = time.monotonic()withtracer.start_as_current_span("voice.stt"):
text = transcribe(audio)reply = generate(text)# the instrumented client adds the chat spanwithtracer.start_as_current_span("voice.tts")astts:
first = Trueforchunkinsynthesize(reply):
iffirst:
tts.add_event("voice.first_audio")waited = time.monotonic() - startedturn.set_attribute("voice.time_to_first_audio",waited)first = Falsesend_audio(chunk)
importtimedefrun_turn(audio,conversation_id,avatar_session_id,session_link):
withtracer.start_as_current_span("voice.turn",links=[session_link])asturn:
turn.set_attribute("gen_ai.conversation.id",conversation_id)turn.set_attribute("avatar.session.id",avatar_session_id)started = time.monotonic()withtracer.start_as_current_span("voice.stt"):
text = transcribe(audio)reply = generate(text)# the instrumented client adds the chat spanwithtracer.start_as_current_span("voice.tts")astts:
first = Trueforchunkinsynthesize(reply):
iffirst:
tts.add_event("voice.first_audio")waited = time.monotonic() - startedturn.set_attribute("voice.time_to_first_audio",waited)first = Falsesend_audio(chunk)
importtimedefrun_turn(audio,conversation_id,avatar_session_id,session_link):
withtracer.start_as_current_span("voice.turn",links=[session_link])asturn:
turn.set_attribute("gen_ai.conversation.id",conversation_id)turn.set_attribute("avatar.session.id",avatar_session_id)started = time.monotonic()withtracer.start_as_current_span("voice.stt"):
text = transcribe(audio)reply = generate(text)# the instrumented client adds the chat spanwithtracer.start_as_current_span("voice.tts")astts:
first = Trueforchunkinsynthesize(reply):
iffirst:
tts.add_event("voice.first_audio")waited = time.monotonic() - startedturn.set_attribute("voice.time_to_first_audio",waited)first = Falsesend_audio(chunk)
transcribe, generate, synthesize and send_audio stand for your own stage functions. Because the turn span is current when generate runs, the library's chat span nests under it with no extra code. The link uses the span links API from the OpenTelemetry Python instrumentation guide.
The conventions list no well-known operation name for transcription or synthesis. Leave gen_ai.operation.name off those two spans until the conventions add one. You can still set gen_ai.provider.name and gen_ai.request.model on them so a backend groups all three stages by vendor and model. If a framework such as LiveKit Agents or Pipecat runs the stages for you, check whether it already emits spans for them before you wrap anything by hand.
Add avatar spans for a realtime session
Give the avatar session its own short trace, and connect every turn to it with a span link and a shared session ID attribute. A session can run for many minutes. A parent span held open that long is lost if the process dies before it ends.
Session start
With the Protoface LiveKit plugin, avatar.start(...) creates the session and puts its sess_... ID on avatar.session_id. Wrap that call:
The span times session creation from your agent's side, and each voice.turn links to session_link. If you call POST /v1/sessions yourself, set error.type to the error.code in a failed response, for example concurrent_sessions or session_start_rate_limited. The Protoface docs keep error.code stable and say the message may change. A rising count of concurrency errors is a capacity signal: see load balancing WebRTC sessions across servers.
First video frame
A Protoface session moves through queued, starting and running, and first_frame_at is set when the first frame reaches the room. Read both timestamps from GET /v1/sessions/{id} and write a span with explicit start and end times:
The function polls once a second until the first frame or a terminal status, then records a span from created_at to first_frame_at. Start it with asyncio.create_task(record_first_frame(avatar.session_id)) inside the avatar.session.start block so it joins that trace, and keep a reference to the task so it is not garbage collected. The API reference also names a session.first_frame webhook, which replaces the polling. Both timestamps come from Protoface's clock, so the duration is exact, but the span can sit slightly off from your local spans.
Stream health
The server and the viewer see different things, so record both. On the server, the session object has usage.frames. The API reference calls those counters eventually consistent, so a flat frame count is a hint, not an alarm. Record the final status when the session ends: by default a session closes after 30 seconds without inbound audio, and the Protoface docs say that timer follows the audio your agent sends, not when the visitor stops speaking. Unlogged, that looks like a crash to the user.
Keep custom names out of the gen_ai. namespace. A future release of the conventions could define the same name with a different meaning.
Metrics to track for GenAI voice and avatar apps
Take model duration, time to first chunk and token counts from the standard metrics, and add three histograms of your own: turn duration, time to first audio and time to first frame.
waited is the value from the turn code, model is the model name you requested, and frame_seconds is first_frame_at minus created_at. Never put a session ID, conversation ID or transcript on a metric: every new value creates a new time series. Those belong on spans.
Your target for first-audio time depends on your models, region and network. Record a week of your own traffic, read the 50th and 95th percentiles, and alert on a change from that baseline.
Export and read the telemetry
Point the OTLP exporter at a Collector or a backend, then debug one slow turn at a time by reading its span tree. The exporters in the setup code read OTEL_EXPORTER_OTLP_ENDPOINT, which the OTLP exporter configuration reference defaults to http://localhost:4318 for HTTP. Use OTEL_EXPORTER_OTLP_HEADERS for a backend's auth header.
Both values are placeholders. To find the slow stage in a turn:
Query for voice.turn spans and sort by voice.time_to_first_audio, highest first.
Open one trace. The three children sit on one timeline, so the widest bar is the stage to fix.
On the chat span, compare gen_ai.response.time_to_first_chunk with the span's full duration. A long wait for the first chunk points at the model or the prompt size. A short wait and a long tail points at output length.
Check the gaps between children. Time that belongs to no span is your own code: buffering, turn detection or a queue.
If audio was on time but the user saw nothing, follow the link to the session trace and read avatar.first_frame and avatar.session.status.
Filter every span by avatar.session.id to rebuild the whole call in order.
Common questions
Which OpenTelemetry GenAI instrumentation libraries exist for Python?
The opentelemetry-python-genai repository publishes packages for OpenAI, the OpenAI Agents SDK, Anthropic, Amazon Bedrock, Google GenAI, LangChain, LlamaIndex, DSPy and several other frameworks. They are beta releases, so pin the version you deploy.
Are the GenAI semantic conventions stable?
No. The spans, metrics, token metrics and events documents in the GenAI conventions repository are all marked Development, so attribute and metric names can still change between releases.
Do the GenAI conventions capture prompts and responses, and how do I turn that off?
Not by default. Message content is opt-in in the conventions, and the Python OpenAI instrumentation defaults OTEL_INSTRUMENTATION_GENAI_CAPTURE_MESSAGE_CONTENT to no_content. Leave it unset, or set it back to no_content, to keep prompts and replies out of your telemetry.
Which observability backends read OpenTelemetry GenAI data?
Any backend that accepts OTLP can store the spans and metrics, because they are ordinary OpenTelemetry signals with agreed names. What differs is whether a backend builds model, token and conversation views on top of the gen_ai.* attributes, so check its documentation for the convention version it reads.
Put a face on the agent you are tracing
Protoface Realtime turns your agent's audio into live avatar video and reports when the first frame lands, so the avatar fits the same trace as the rest of the turn.