

WebRTC latency is the delay between capture on one device and playback on another. On a good network it stays well under half a second: one published test measured 170 ms glass to glass. Read each stage from getStats() in the browser, then cut the largest one first, usually network distance, a relay or the jitter buffer.
How much latency does WebRTC have?
A WebRTC call on a healthy network adds a few hundred milliseconds at most, and the transport is rarely the largest part. Transitive Robotics published a stage-by-stage WebRTC latency breakdown that measured 130 ms glass to glass on a local connection and 170 ms through a relay server 30 ms away by ping. About 100 ms of that was the USB camera, before WebRTC touched a single frame.
For a target, the ITU-T G.114 recommendation on one-way transmission time sets 400 ms of one-way delay as the ceiling for network planning, and warns that voice calls suffer at much lower delays.
If you are still choosing a transport, start with the comparison of WebRTC vs WebSocket for realtime AI.
Where WebRTC latency comes from
Delay accumulates in six stages: capture, encode, network, jitter buffer, decode and render. Only the network stage depends on distance.
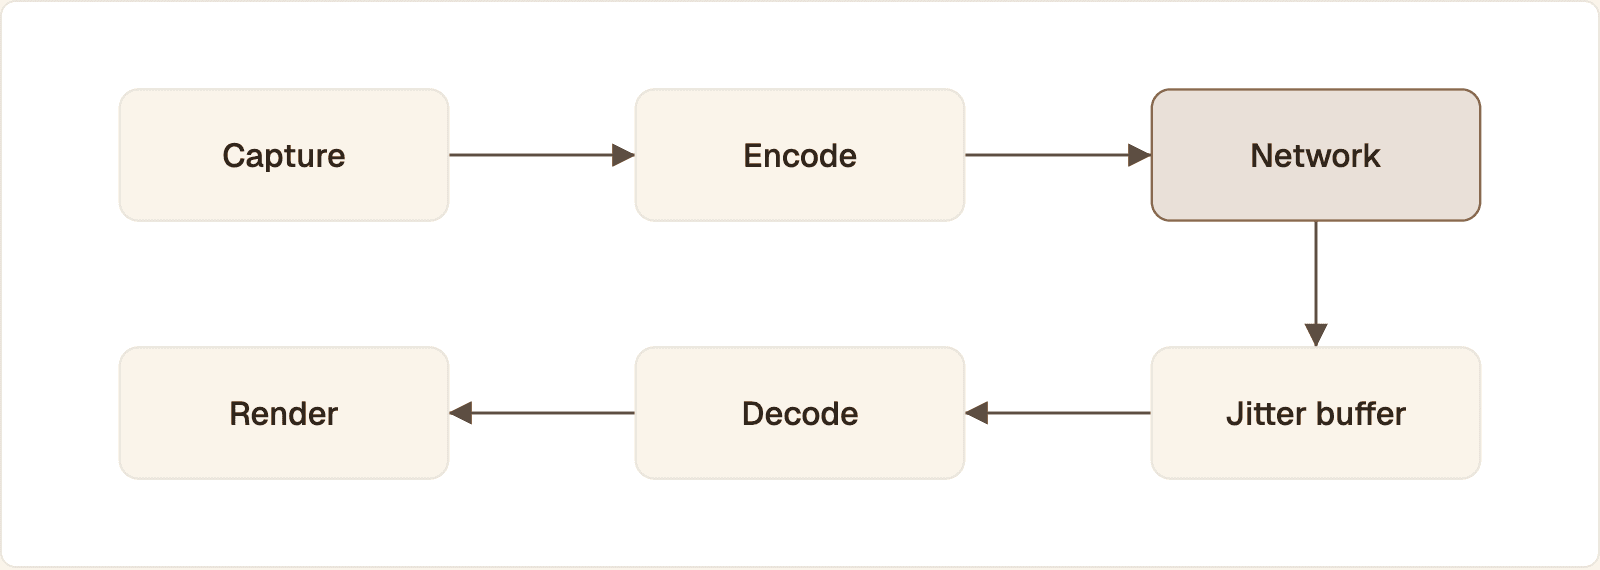
The top row runs on the sender and the bottom row on the receiver. Only the network hop between them grows with distance.
Stage | What sets the delay | Transitive Robotics measured | Where you read yours |
|---|---|---|---|
Capture | Camera exposure, sensor readout, USB transfer, audio device buffer | About 100 ms | Glass-to-glass test minus the other stages |
Encode | Codec, resolution, hardware or software encoder, CPU load | 10 ms or less |
|
Network | Distance to the media server, relays, congestion | 30 ms round trip to the relay |
|
Jitter buffer | Variation in packet arrival, loss, retransmissions | 7 to 10 ms |
|
Decode | Codec, resolution, hardware decoder availability | 10 ms or less |
|
Render | Compositor and display refresh | Up to 17 ms at 60 Hz |
|
Those figures come from USB cameras on an Ubuntu desktop at 30 frames per second, a software H.264 encoder and a 60 Hz display. Yours will differ most in the network and jitter buffer rows, which follow the user's connection.
How the jitter buffer adds delay
Packets do not arrive evenly spaced, so the receiver holds media briefly and releases it at a steady pace. The worse the arrival timing, the deeper the browser makes that buffer, and every frame then waits that long. A short round trip with unstable timing can feel slower than a longer, steady one. Loss makes it worse on video, because the buffer waits for retransmitted packets before a frame is complete.
How to measure latency in the browser
Call getStats() on the RTCPeerConnection and read four numbers: round trip time, jitter buffer delay, decode time and packets lost. The W3C WebRTC statistics specification defines each field. Most are running totals in seconds, so divide by a count and subtract the previous sample.
Each run prints the active path's round trip and one row per incoming stream. receiveToDecodedMs is the time from the first packet of a frame arriving to that frame being decoded, so it covers the jitter buffer and the decoder together.
What each number tells you
Round trip time is high. The media server or relay is far from the user.
Jitter buffer delay is high, round trip is low. Arrival timing is unstable: weak Wi-Fi, congestion or a TCP relay.
Decode time climbs or frames per second drops. The device is short on CPU. Lower the resolution it receives.
Packets lost keeps growing. The sender is pushing more bitrate than the path carries.
All four look fine and the call still lags. The delay is before the transport: capture, or the time your agent takes to produce speech.
The same figures in webrtc-internals
In Chrome, open chrome://webrtc-internals in a second tab while the call runs. It plots the same statistics over time and derives the per-interval ratios for you: the graphs with names in square brackets, such as jitter buffer delay per emitted frame in milliseconds. Use it to see when a spike happened, and your own logging for real users. Platform SDKs such as LiveKit and Agora expose comparable statistics through their own APIs.
How to measure glass-to-glass latency
Glass-to-glass latency is the time from light entering the camera lens to the matching pixels appearing on the viewer's screen. Stats cannot see the camera sensor or the display, so you measure it with a clock both ends can see.
Show a millisecond clock on a monitor: a page that prints
performance.now()on every animation frame.Point the sending camera at that clock.
Put the receiving screen next to the clock.
Photograph both screens in one shot with a phone.
Subtract the transmitted reading from the live reading. Repeat ten times and keep the median, since each reading is only as precise as the display refresh interval.
Timing the receive side in code
The browser reports per-frame timing for the receiving half. MDN documents the requestVideoFrameCallback() metadata, which adds receiveTime and an estimated captureTime for WebRTC sources.
The first line runs from a frame's last packet arriving to its display: jitter buffer, decode and the next refresh. The second depends on a capture time the browser estimates from clock synchronization and sender reports, so check it against the clock method before you trust it.
How to reduce WebRTC latency
Fix the stages in order of size: network distance, then relays, then the jitter buffer, then the encoder. Measure after each change, because a fix for one stage can raise another.
Put the media server near the user. Round trip time is a floor that nothing on the client lowers. Host your agent in the same region as the media server.
Check whether the call is relayed. A TURN relay adds a detour, and a relay over TCP or TLS stalls under loss.
Stabilize arrival before shrinking the buffer. A strong connection and a bitrate the uplink can carry do more than any buffer setting.
Cap bitrate and resolution. An encoder that overshoots causes queueing and loss, which the receiver pays for in buffer depth.
Protect the decoder. Keep one persistent
<video>element and do not remount it on framework state changes.
Find out if you are on a relay
A candidateType of relay means media goes through TURN. A relayProtocol of tcp or tls means the browser reached the TURN server over TCP, usually because the network blocks UDP. RFC 8835 requires every WebRTC endpoint to support both fallbacks, so the call connects, but with TCP's stalls on that leg. Whether media flows directly or through a server is covered in the explainer on WebRTC SFU, P2P and MCU topologies.
Tune the jitter buffer and the encoder
MDN describes jitterBufferTarget as a preference in milliseconds, up to 4000, that influences the buffer without setting it directly. A lower target trades delay for more audio gaps and video freezes, so watch playback after you set it. It is newly available across browsers, so the code checks for it. The sender fields are documented under RTCRtpSender.setParameters().
When viewers have very different connections, publishing several layers and letting the server choose is the job of WebRTC simulcast and bandwidth adaptation.
Latency budget for a realtime AI agent or avatar
In a voice agent, WebRTC is two short legs around a long middle. The user also waits for turn detection, speech recognition, the model, speech synthesis and, with an avatar, video rendering.
Stage | What the user is waiting for | How to measure it |
|---|---|---|
Turn detection | The agent deciding the user has finished | Timestamp of last user speech vs end-of-turn event |
Speech recognition | Final transcript | End-of-turn event vs final transcript |
Language model | First token of the reply | Request sent vs first streamed token |
Speech synthesis | First audio of the reply | First text sent vs first audio chunk |
Avatar | Video frames matching that audio | First audio sent to the avatar vs first frame published |
Log a monotonic timestamp at each boundary in your agent process, tagged with one turn ID. The WebRTC legs on either side come from the browser stats. A speech-to-speech model collapses recognition, model and synthesis into one stage: user stops speaking to first audio out.
The Protoface docs publish no per-stage latency figures, so measure your own. The API does give you the startup timeline. Protoface Realtime renders a face from the audio your agent already produces, and each session records when it was created, when the worker started and when the first frame reached the room:
Subtract created_at from first_frame_at in the response for the avatar's startup time in your setup. The same moment is delivered as a session.first_frame webhook.
Cut the wait before the first reply
Start the avatar early. A session moves through
queued,startingandrunning. With the LiveKit plugin, start theAvatarSessionbefore the agent session.Keep one session for the whole conversation. A new session per turn pays startup every time. A session also ends after
idle_timeout_secondswithout received audio, 30 by default and at most 600, so set it to fit the pauses in your flow.Take slow work off the speech path. Record writes and eligibility checks can run after the agent has started talking.
Stream every stage. Send the first complete clause to speech synthesis.
Edge functions or a regional API for session setup
Run only short, stateless work at the edge: checking the user's login, choosing a region, minting a short-lived token. Create the session from a regional backend that holds your API key and sits near your agent. Edge placement shortens one HTTPS request and does nothing for the media path or the model, which is where the time goes. To keep keys off your page entirely, a Protoface embed carries only a public embed ID.
Lower delay must not cost accessibility. Treat the avatar video as decoration for assistive technology. Keep a text transcript as the source of truth, announce finished turns in a live region, not every partial word, and label the mute and end controls.
WebRTC latency compared with HLS, RTMP and WebSocket
WebRTC is the only one of the four built to drop late media instead of waiting for it, which is why it holds sub-second delay on imperfect networks. The others deliver every byte in order over TCP and pay for it in buffering.
Protocol | Transport | Expected delay | Typical use |
|---|---|---|---|
WebRTC | RTP over UDP, TCP relay as fallback | Sub-second: 130 to 170 ms in the Transitive Robotics test | Calls, voice agents, avatars, remote control |
WebSocket | One TCP connection | Close to WebRTC on a clean link, stalls when packets drop | Signaling, events, server-to-server audio |
RTMP | One TCP connection | Seconds, set by encoder and player buffers | Sending a stream from an encoder to a platform |
HLS | Media segments over HTTP | Several segment lengths, so many seconds | One-way broadcast to large audiences |
The HLS figure follows from the protocol. RFC 8216 says a client should not start playback less than three target durations from the end of a live playlist, so a player that follows it on a stream with a six-second target duration starts at least 18 seconds behind. If the viewer talks back, as they do with an agent or an avatar, use WebRTC on the hop that reaches them.
Common questions
Is 700 ms latency bad?
As one-way media delay, yes. ITU-T G.114 advises staying under 400 ms and notes that conversation suffers at much lower delays. As the gap before a voice agent starts its reply, 700 ms also covers speech recognition, the model and speech synthesis, so judge it by whether users talk over the agent.
Is WebRTC over TCP or UDP?
UDP by default. WebRTC sends media as RTP over UDP, and RFC 8835 requires endpoints to also support TURN over TCP and over TLS for networks that block UDP. Latency is worse on those fallbacks because TCP holds back later packets until a lost one is resent.
Is WebRTC faster than RTMP?
Yes for anything interactive. WebRTC runs over UDP and skips media that arrives too late, so delay usually stays under a second. RTMP delivers every byte in order over TCP and relies on buffers, which puts it seconds behind. Browsers also cannot play RTMP directly.
What are the downsides of using WebRTC?
You have to build or buy signaling, run STUN and TURN servers and debug failures that only show on other people's networks. Reaching many viewers needs media servers, which cost more than serving HLS segments from a CDN, and low delay means dropped frames stay dropped.
Does a TURN server add latency?
Yes. Relayed media takes a detour through the TURN server, so the added delay is the extra distance of that path. A relay over TCP or TLS also stalls when packets are lost. Check candidateType and relayProtocol in getStats() and place relays close to your users.
What is the lowest latency WebRTC can reach?
The floor is set by hardware and distance, not by the protocol. In the Transitive Robotics test, a local WebRTC connection measured 130 ms glass to glass, about 100 ms of it from the USB camera, with encode, jitter buffer and decode near 10 ms each.
Give your low-latency agent a face
Protoface Realtime renders a live avatar from the audio your agent already produces. Add it to a LiveKit or Pipecat agent and time the first frame yourself.